A data-backed deep dive into DuckDB using TPC-H Benchmarks
banchmarks
duckdb
Author
Hussain Sultan
Published
April 22, 2023
Modified
July 29, 2023
tl;dr
I tune SQL queries in DuckDB to consume less energy by turning a few knobs.
Turning Knobs
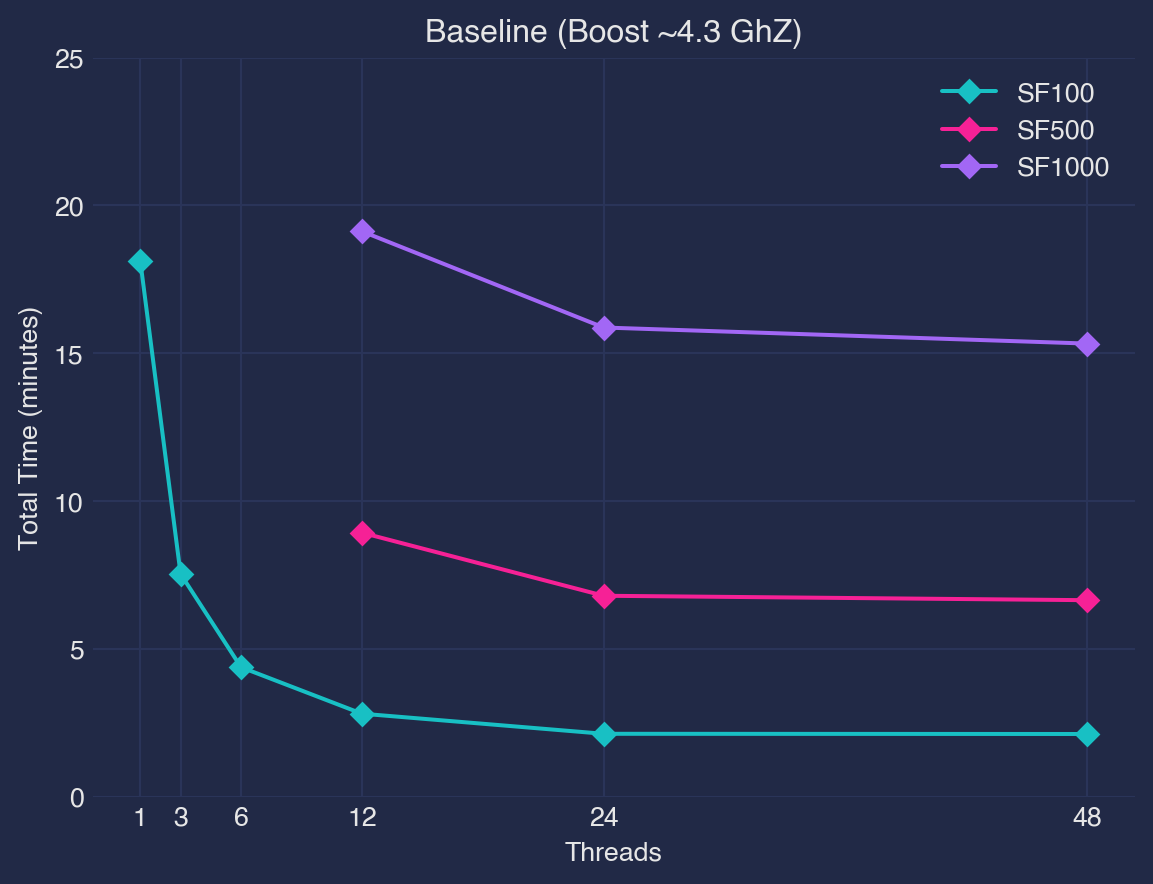
In this post, I use TPC-H data at SF100, SF500, and SF1000 on a hefty, consumer-grade desktop machine to test the limits of DuckDB. DuckDB scales well to a terabyte scale-factor for most queries (failing 4/22) on the tested desktop system. It can be further tuned for energy-efficient database operations by configuring threads and dynamically setting CPU core speeds. DuckDB does not scales linearly as number of threads increase indicating poor usage of high thread-count CPU machines`.
Replicating these benchmarks on other hardware requires this code repository with the benchmarking program. The resulting dataset is here.
Energy Efficient DuckDB
DuckDB is one of the world’s most popular query engines, and it is fast changing people’s perceptions of how “big” big data is. Indeed, DuckDB is quite snappy1 for 1 TB scale factor, which is billions of rows of data. It does that by implementing state-of-the-art database research while taking advantage of recent hardware level optimizations.
DuckDB can be set up to run with a certain amount of memory and a number of threads. With CPU scaling configurations exposed at the operating system level, I ran benchmarks to find the sweet spot configurations in terms of total execution time and energy use.
Trading-off Speed
SQL queries can be optimized in sweet spots2 with high performance-to-power consumption ratios. Implementing a race-to-idle strategy may not always be the most power efficient. The idea of being “too fast” becomes equivalent to trading-off speed for power consumption entirely with software configurations.
CPU frequency and number of threads are both influential factors on energy consumption and latency, and the ability of the application to determine the existence or absence of an energy-optimal configuration can lead to its energy-awareness.
Benchmarking Set-up
I wrote a small utility in Python to prepare the TPC-H data, measure, and run the TPC-H query sets at the scale factor (SF100, SF500, SF1000) with total time, energy (J) and power (W) as outputs. The utility also lets you configure the number of threads to use with DuckDB and works across both Linux and Mac. The energy measures only records CPU consumption and do not include DRAM measures, for example. All experiments were repeated 4 times and average of the values was used in the analysis.
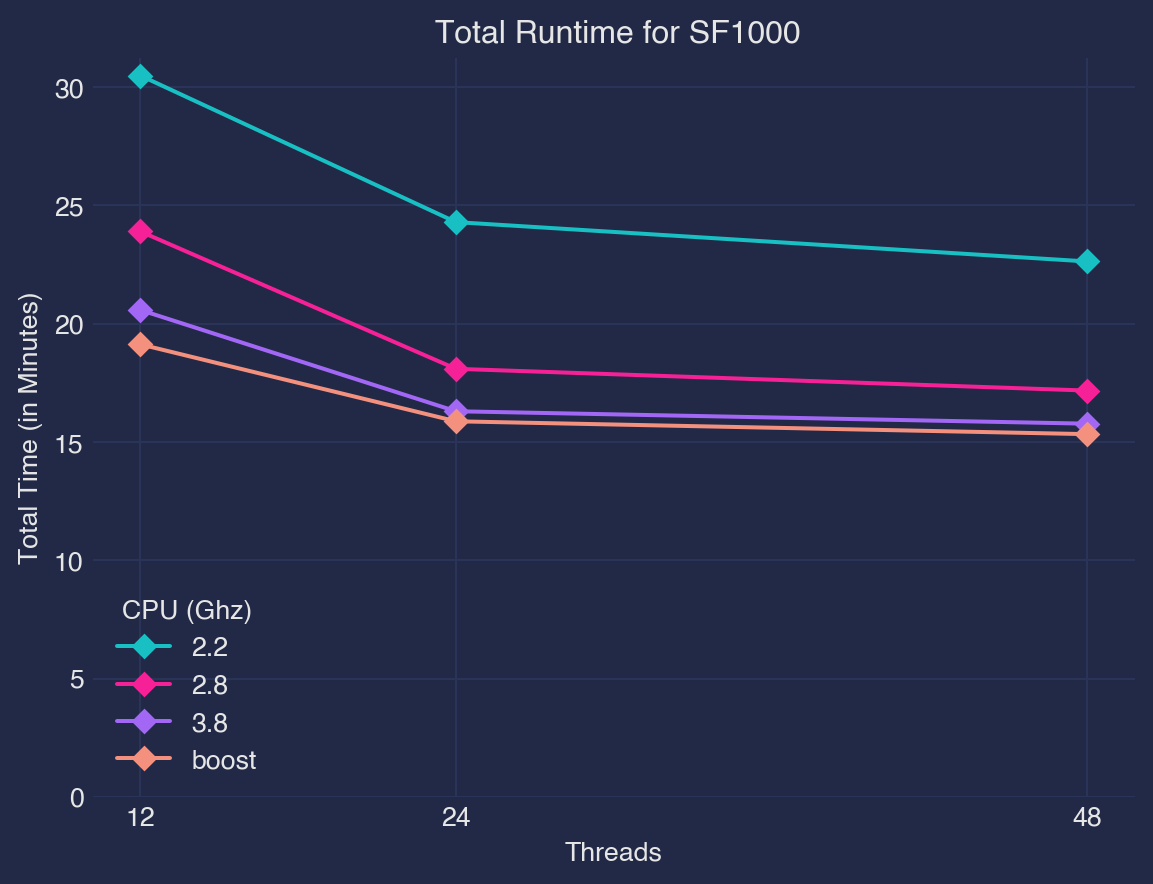
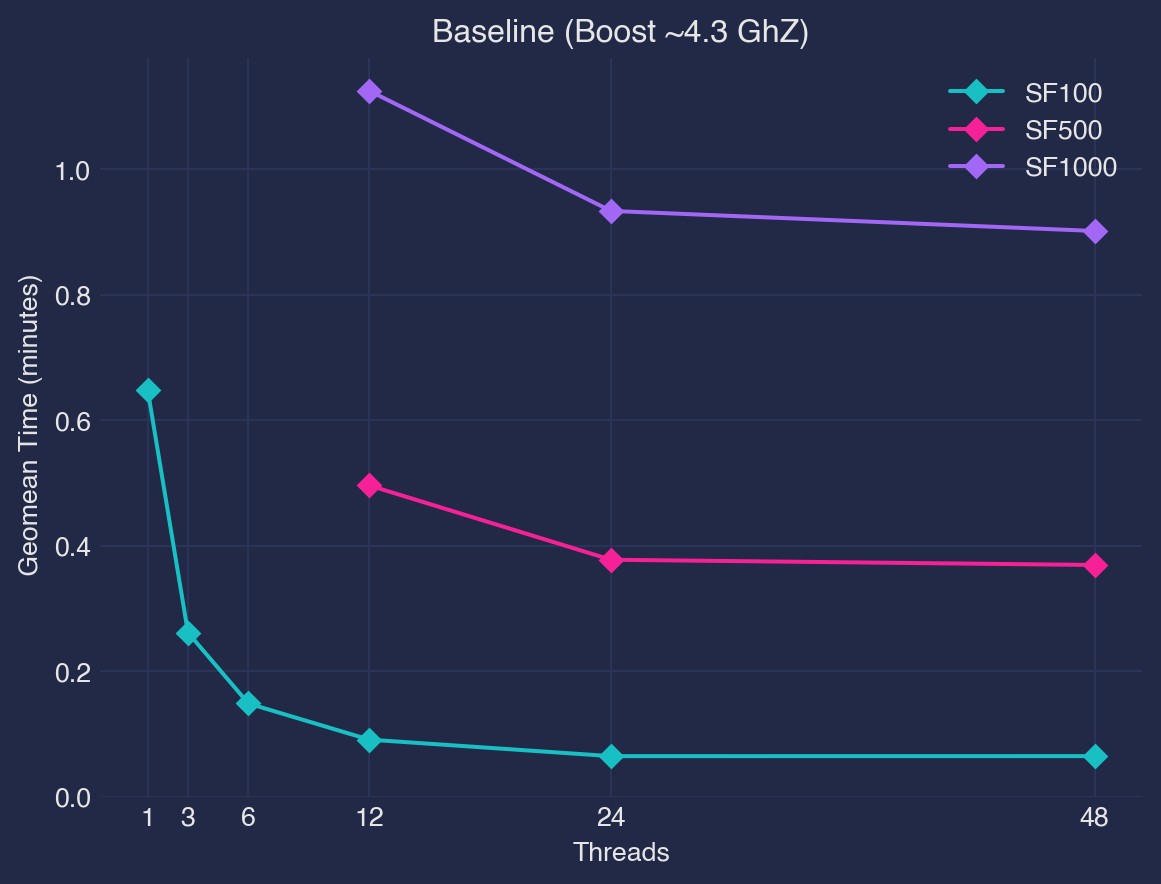
Threads (1,3,6,12,24,48) , CPU Frequency (2.2 Ghz, 2.8 Ghz, 3.8Ghz, boost >4Ghz)
Power Readings
Outside of being able to measure the power usage via a hardware power meter, the software based measurements for power come from the RAPL (Running Average Power Limit) interface widely available in modern CPUs. The RAPL values are computed using a power model that uses processor-internal counts as inputs, and they have been verified as being fairly accurate. This technique allows for the retrieval of the CPU’s overall energy usage, as well as the consumption of individual CPU sockets and, in some situations, the Memory controller3. CPUs often account for the machine’s greatest percentage of total energy usage (except when running GPU intensive workloads, for example).
Dynamic Voltage and Frequency Scaling (DVFS) framework is utilized to minimize the power usage typically incurred by the operating system. DVFS is based on predefined relationships between power consumption, CPU frequency, and voltage. The Linux Kernel supports DVFS settings and allows for software to set the frequency. This is how your laptops know when to use less power and turn the CPU cores down when battery goes low.
Results
Here are a few take-aways:
DuckDB does not scale linearly with the number of threads. As the size of the data grows, the amount of CPU time used goes up steadily but not in a straight line. Relative performance is better when there are fewer threads than when there are many4.
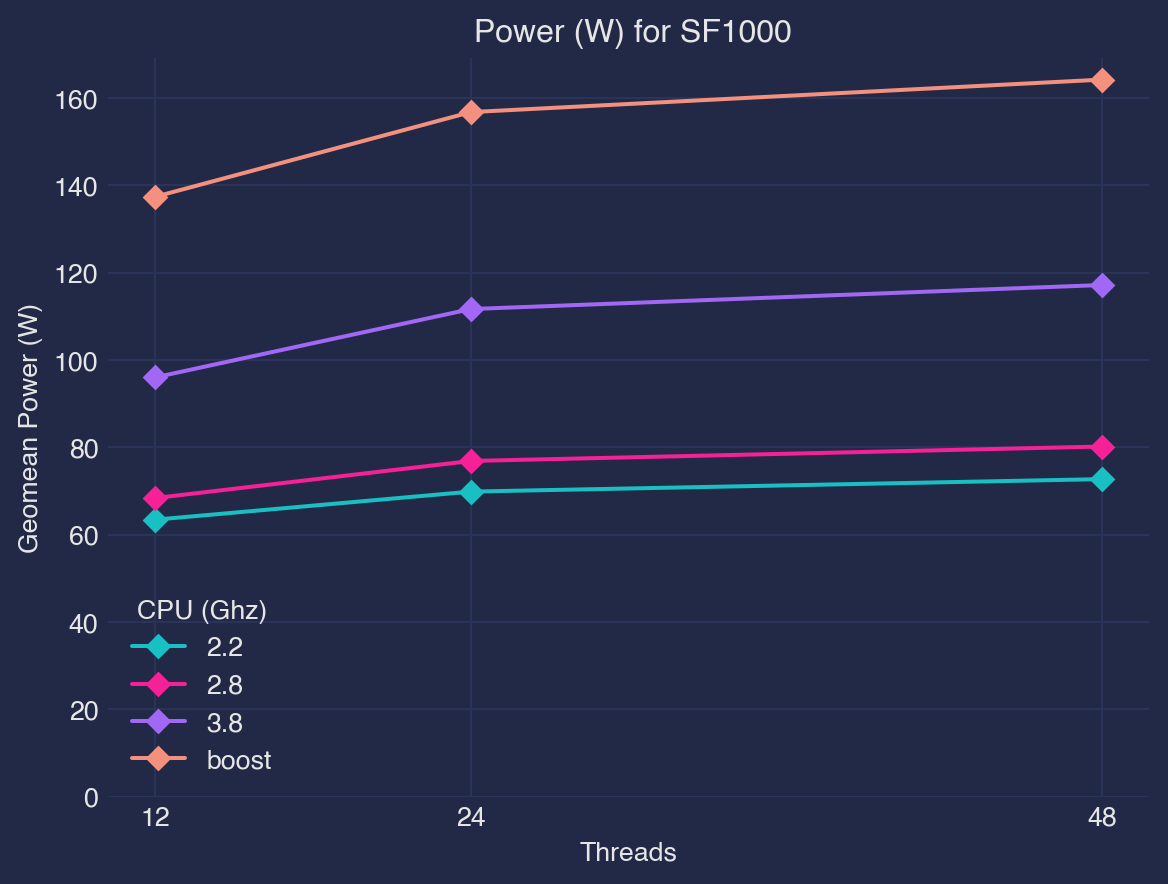
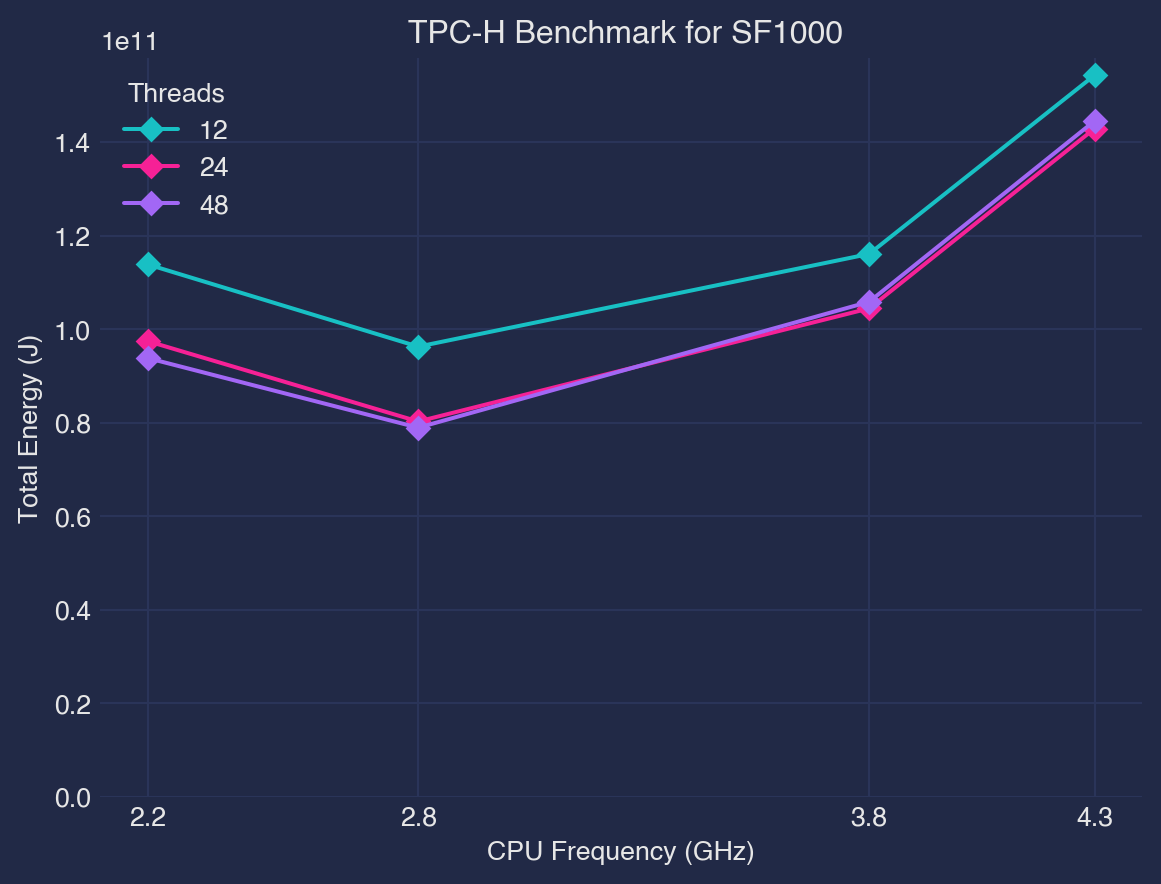
CPU frequency also scales non-linearly with respect to power i.e. lowest CPU frequency setting is not always the most energy optimal.
In energy optimal case, H05, H06, H08, H11, H12, and H14 exhibit >80% energy gains under 5% allowed tradeoff with speed as compared to the baseline (default CPU frequency with Boosting and 48 threads) at SF1000.
Compared to the default settings (boost + 48 threads), there are “sweet spot” for CPU frequency and number of threads for 11/18 queries that result in over 80% change in energy consumption while being less than 5% slower.
Under 128GB of total system RAM, 4/22 queries at 1TB scale fail, indicating some issues with out-of-core performance.
DuckDB’s default paradigm is in-memory with out-of-core considerations. This design philosophy shows iterating and adding the out-of-core functionality later. For example, window operations were all materialized in-memory and were later added for out-of-core functionality.
Table 1: TPC-H at Various Scale Factors (128 GB RAM)
Scale Factor
Failed Queries
sf100
[]
sf500
[‘h18’, ‘h21’, ‘h17’]
sf1000
[‘h18’, ‘h17’, ‘h21’, ‘h04’]
For H21, it joins two hash table, which both need to spill to disk. The hash tables aren’t aware of each other and hence go out of memory5
Other Thoughts
There are a few limitations to this approach:
This is only measuring the CPU power and ignores the rest of the system’s energy costs e.g. DRAM. DRAM costs could be nontrivial under certain criteria.
The benchmarking program itself has an overhead, and these benchmarks should only be looked at relative to each other as all benchmarks were run under a similar overhead scenario.
Some future work that could be interesting:
Deep-dive into the individual queries and the TPC-H choke-points to understand the operator level performance with regards to energy consumption
Analyze complete power usage including DRAM and other components besides CPU
Include different hardware with varied frequency scaling settings
Experiment with other embedded query engines e.g. datafusion
For the queries that did not go out-of-memory, the total time to run the the TPC-H set is under 20 minutes↩︎
Here is a research paper that explores sweet spot frequencies for MonetDB. It is worth it to mention that MonetDB is related to DuckDB and it is sighted as prior-art↩︎
It turns out that web browsers really care about energy efficiency and it is no surprise that Firefox has done a lot of work in benchmarking power metrics. Mozilla’s documentation on power metrics overview is an excellent read.↩︎
Fivetran discovered the same insight for tpc-ds but did it by changing the instance size instead of just the number of threads here↩︎
Here is the GitHub issue. Thanks to @min_djo for pointing it out↩︎